It’s a staple of financial journalism – the monthly release of inflation numbers drives a report that tells us the current rate of inflation and how it has changed since last month.
Only it doesn’t. Both numbers are not what they claim to be, and can be substantially misleading.
How so? Let’s start with the inflation rate. This comes from the monthly release of the Consumer Price Index (CPI), the current cost of a ‘basket’ of goods and services that reflects the things we buy. The reported inflation rate is the current CPI divided by the CPI from a year ago, so it is the sum (actually the product) of the last 12 months of monthly inflation [1]. Despite being in the news section, this annualized number tells us as much about inflation a year ago as it does last month.
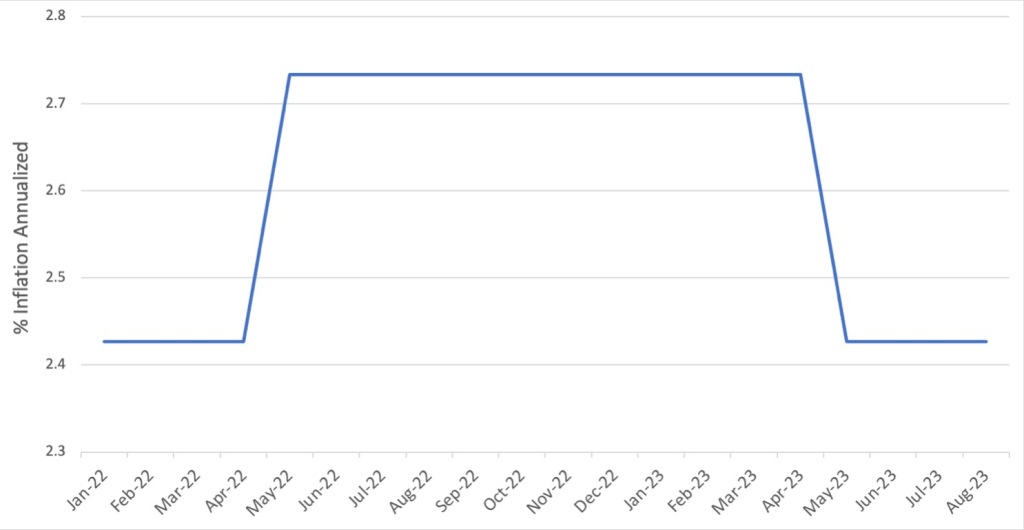
Let’s look at very simple model, in which inflation is always 0.2% per month, but for one month, it spikes up to 0.5%:

When we calculate the 12-month inflation average, we see a jump from 2.4% to 2.7% in May 2022, but while real inflation comes back down again in June, this annualized inflation stays incorrectly high for a whole year, with that spike staying in the average until April 2023:
The monthly change-in-inflation calculation gets even more screwy:

It actually does a fine job of showing the spike up and down of inflation in May 2022, but then look a year forward, at May 2023, and you’ll see a phantom dip of the same amount, despite no change at all in real inflation, but because the Apr 2022 spike is no longer in the monthly average, it drops down.
If we look at real inflation numbers, the errors are not so extreme, but can still be substantial:

The New York Times headline on Jul 12 2023 said “Inflation Cools Sharply in June, Good News for Consumers and the Fed“, and higlighted a ‘substantial’ drop in annualized inflation in June from 4% to 3%. Yet the monthly figures above show that inflation actually went up in June (0.32% vs. 0.25% in May). Why the discrepancy? Well, the May annualized inflation (4%) was the product of the 12 monthly inflation figures from June 2022 to May, while the June figure (3%) was the product of July 2022 to June. To calculate the difference, you divide one set of 12 monthly figures by another – but 11 of those cancel out, and so the reported change in inflation ends up being something very strange – the Jun 2023 inflation rate divided by the inflation rate from June 2022, a full year earlier. Instead of comparing June to May of 2023 to get an accurate (if somewhat noisy) number, it uses the almost nonsensical number from a year ago, to produce a rate change that is frequently very misleading. In this case, because inflation was higher in June 2022 than June 2023, the annualized rate looks like it’s falling from 4% to 3%, but only because the calculation is so wrong.
I’m not an economist, and I’m guessing (hoping) that the people who really need accurate inflation figures know all this and aren’t driving the economy on the back of newspaper articles and bad arithmetic. But that still leaves millions of us who do make decisions based on what we read in the papers, so maybe it’s time to ditch these inflation metrics for something better. Read on to see what ‘something better’ might look like.
Gruesome Details
[1] The annual inflation is the product, not the sum of the inflation figures for each month. If inflation in May is 0.2%, that means that the May CPI is 1.002 times the April CPU. Multiplying that 1.02 by the equivalent figures for the last 11 months gives you the annualized inflation figure for May.
